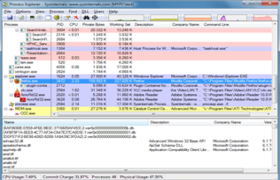
Process Explorer
- PLATFORM:
License: Freeware
Features:
- Hierarchical view of processes.
- Ability to display an icon and company name next to each process.
- Live CPU activity graph in the task bar.
- Ability to suspend selected process.
- Ability to raise the window attached to a process, thus "unhiding" it.
- Complete process tree can be killed.
- Interactively alter a service process's access security
- Interactively set the priority of a process
- Disambiguates service executables which perform multiple service functions. For example, when the pointer is
- placed over a svchost.exe, it will tell if it is the one performing automatic updates/secondary logon/etc., or the
- one providing RPC, or the one performing terminal services, and so on.
- There is an option (in a process's context menu) to verify a process in VirusTotal
- There is an option to display DLLs loaded by process (View => Lower Pane View => DLLs); an option Show Lower
- Pane has to be switched on
- There is an option to display processes handles which includes named mutants, events, sockets, files, registry
- keys etc. (View => Lower Pane View => Handles); an option Show Lower Pane has to be switched on
- In properties of a process a user can view the process's threads and threads stack traces
- There is a command to create a process dump (mini or full) (Process => Create Dump)
- There is a Find command which allows for searching a handle or DLL which can be used to identify the process
- (es) holding a file lock.
- There is an option (in handle context menu) to close a selected handle